Net Promoter Score in 2025: What It Is and Why It Matters
NPS is one of the most used metrics in customer experience—but are you using it right? Here's what it measures, how to calculate it, and where it falls short.
The One Question That Tells You a Lot
Imagine you could ask every customer just one question. One question that tells you whether they'd stick around, refer friends, or quietly walk away. That's exactly what Net Promoter Score tries to do.
NPS is built around a single survey prompt: How likely are you to recommend us to a friend or colleague? Customers answer on a scale from 0 to 10. That's it. From that one number, businesses draw conclusions about loyalty, satisfaction, and growth potential.
It sounds almost too simple. And honestly, that simplicity is both its greatest strength and its most common criticism. But before we get into the debate, let's make sure you understand exactly how it works.
How NPS Actually Works
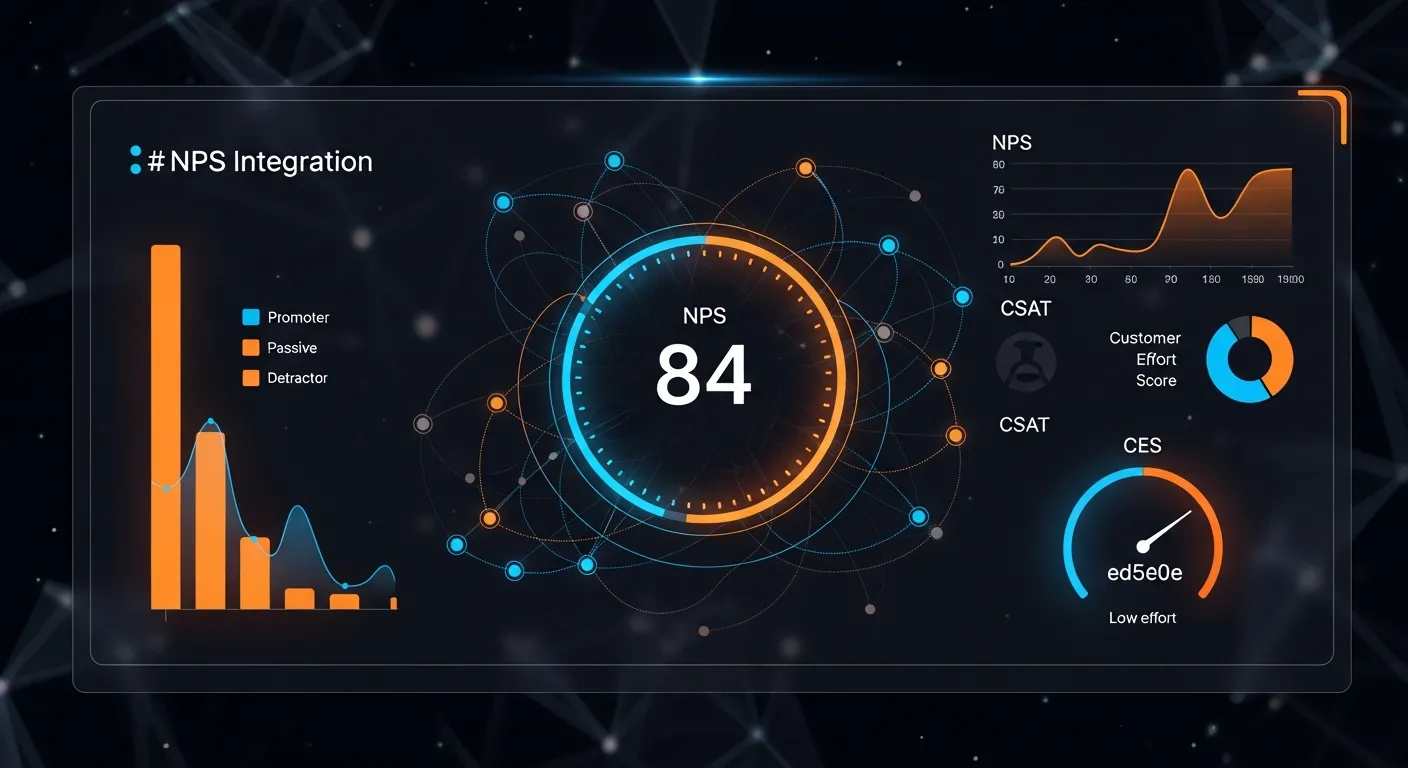
When customers respond to the NPS survey, they fall into one of three groups based on their score.
Promoters score 9 or 10. These are your fans. They buy more, refer others, and tend to stay loyal longer. Passives score 7 or 8. They're satisfied but not enthusiastic—easy to lose to a competitor. Detractors score 0 through 6. They're unhappy, and some of them will share that unhappiness publicly.
To calculate your NPS, subtract the percentage of detractors from the percentage of promoters. Passives are counted in your total responses but don't directly affect the final score.
Here's a quick example. Say 60% of your customers are promoters and 15% are detractors. Your NPS would be 45. Scores can range from -100 (everyone's a detractor) to +100 (everyone's a promoter).
What Score Should You Be Aiming For?
A score above zero means you have more fans than critics. That's a decent starting point. Scores above 20 are generally considered solid across most industries. Scores above 50 are excellent.
But here's the thing—industry context matters a lot. A score of 30 might be outstanding in enterprise software, where buyers are sophisticated and hard to impress. The same score might be underwhelming in consumer retail, where expectations are different.
Rather than chasing a universal target, track your own trend over time. Is your score climbing, holding steady, or dropping? That trajectory tells you more than any single number.
Why So Many Businesses Still Use It
NPS has been around since the early 2000s. You'd think something newer would have replaced it by now. So why hasn't it?
The honest answer is that simplicity wins in organizations. Customer experience data can get complicated fast. When you're trying to align a sales team, a product team, and a support team around one shared goal, a single score is easier to rally around than a dashboard full of competing metrics.
NPS is also easy to benchmark. Because so many companies track it, you can compare your score to others in your industry. That competitive context helps leadership understand where they stand without needing a data science degree.
There's also a cultural inertia at play. Once a metric becomes embedded in quarterly reviews, board presentations, and executive dashboards, it takes serious effort to replace it. NPS has become part of the language of customer experience. That's not always a good thing—but it does explain why it persists.
Where NPS Falls Short
Here's where we need to be honest. NPS is a useful signal, but it's not a complete picture. Relying on it alone is like navigating with only a compass—you know which direction you're heading, but not what obstacles are in your path.
It Doesn't Tell You Why
A score of 25 doesn't tell you whether customers are frustrated by your pricing, your support team, your onboarding process, or your product itself. You get the what, but not the why. Without qualitative follow-up, NPS is just a number floating in the air.
Smart teams pair NPS with an open-ended follow-up question. Something like: What's the main reason for your score? Those text responses are where the real insights live. They surface patterns you'd never find in a number alone.
It Misses the Moment
NPS is often sent as a periodic survey—quarterly, annually, or after a general interaction. But customer feelings are shaped by specific moments. A frustrating support call. A smooth checkout. A product bug that cost someone an hour of work.
If you're only measuring loyalty in broad strokes, you miss the touchpoints that are actually driving people away. That's why many teams now layer in transactional surveys tied to specific events—a purchase, a support ticket, a product update—rather than relying solely on relationship-level NPS.
Response Bias Is Real
Who actually fills out NPS surveys? Often, it's the people who feel strongly—either very happy or very frustrated. The quiet majority in the middle tends to skip it. That means your score may not reflect your full customer base as accurately as you'd hope.
This doesn't make NPS useless. But it's a reason to treat the score as directional, not definitive.
NPS Works Best as Part of a Bigger System
Think of NPS as the opening question in a longer conversation. It tells you the headline. Other metrics fill in the story.
Customer Satisfaction Score (CSAT) measures how happy customers are with a specific interaction. It's great for evaluating support quality or post-purchase experience. Customer Effort Score (CES) measures how easy it was for a customer to get something done. High effort is a strong predictor of churn. Customer Lifetime Value (CLV) connects loyalty signals to actual revenue, helping you prioritize where to invest in CX improvements.
None of these metrics tells the whole story on its own. But together, they give you a much clearer view of what's working and what isn't.
Key Driver Analysis: The Missing Piece
One of the most underused tools in NPS programs is key driver analysis. This is the process of identifying which specific factors—product quality, support speed, pricing clarity, onboarding ease—have the biggest influence on your NPS score.
Without this analysis, you're guessing at what to fix. With it, you can prioritize improvements that will actually move the needle. Consider a scenario where your NPS drops by 10 points over two quarters. Without driver analysis, you might assume it's a product issue. But the data might reveal it's actually your renewal process that's frustrating customers. That's a very different problem with a very different solution.
How to Run a Smarter NPS Program
If you're going to use NPS, use it well. Here's how to get more out of it than most teams do.
Survey at the right moments. Don't just send a blanket survey every six months. Trigger NPS surveys after meaningful touchpoints—after a customer completes onboarding, after a support case closes, after a major product update. You'll get more relevant feedback and higher response rates.
Always ask a follow-up question. The number is the start, not the finish. Ask customers to explain their score in their own words. Even a handful of open-ended responses can reveal themes you'd never spot in the quantitative data alone.
Close the loop with detractors. When someone gives you a low score, reach out. Not to defend yourself—to listen. Many companies find that a genuine follow-up conversation can turn a frustrated customer into a loyal one. At minimum, it shows you care enough to respond.
Celebrate and engage your promoters. Promoters are an underused asset. They're already willing to recommend you—make it easy for them to do so. Referral programs, testimonial requests, and community invitations are all ways to turn passive enthusiasm into active advocacy.
Track trends, not just snapshots. A single NPS reading doesn't mean much. What matters is whether your score is moving in the right direction over time. Set a cadence for reviewing trends and connect score changes to specific initiatives or events.
The Bigger Picture for 2025
Customer experience measurement is evolving. More teams are experimenting with behavioral data, predictive analytics, and real-time sentiment tracking. Some are questioning whether a single survey question can keep pace with how complex customer relationships have become.
Those are fair questions. But the answer isn't to abandon NPS—it's to stop treating it as the whole answer.
NPS works best when it's a starting point, not a destination. It raises the flag. Your follow-up work—the qualitative analysis, the driver research, the closed-loop conversations—is what actually improves customer experience.
If your team is using NPS as a checkbox metric that gets reported and forgotten, you're leaving most of its value on the table. But if you treat it as a prompt for deeper investigation, it can still be one of the most useful tools in your CX toolkit.
The metric itself hasn't changed much. What's changed is our understanding of how to use it wisely.
Share this article
Join the newsletter
Get the latest insights delivered to your inbox.